
Ice Cream Vending Machine ROI: How to Model Profit Before You Buy
On this page
An ice cream vending machine ROI figure is only as useful as the inputs behind it: the price you can charge, what each serving costs, how many servings a site sells in each month, what the host takes and how often someone has to visit the machine. This guide shows how to build that model line by line with your own numbers, so you can see what a site needs to sell before a machine pays its way. It is written for operators and investors planning a first placement or adding machines to a route in the United States, the UK or Germany. Financing and the tax treatment of the equipment itself are outside its scope.
Industry totals set the scene but cannot stand in for site data. The NAMA Foundation's latest census, developed with Technomic, puts US convenience services revenue at $31.1 billion for 2025.1 Its published summary does not break out frozen desserts, and no public dataset shows what one machine sells at one site, so the model has to be built from the bottom up.
iMaster manufactures ice cream vending machines. Every number in the worked examples below is a hypothetical assumption, labeled as one, and none is taken from an iMaster model or quotation. The examples show how the variables push against each other; they do not predict what any machine will earn. How profitable an ice cream vending machine is depends on a handful of inputs: some you can measure before you buy, and some you can only estimate until a machine has run through a full season.
What actually goes into ice cream vending machine ROI
Return on investment is annual profit after depreciation, divided by the money you put in:
ROI = (annual operating profit − annual depreciation) ÷ total installed cost
Total installed cost covers everything it takes to get the machine selling: the machine, freight, import duty where it applies, installation, electrical work at the site, payment hardware, an opening stock of mix and cones, and a basic spare-parts kit. The figures in this guide are before income tax and before financing. If you borrow, add the interest to your fixed costs.
Operating profit comes from four groups of numbers:
Net revenue per serving: the shelf price minus sales tax or VAT.
Variable cost per serving: mix, cone or cup, toppings, waste, card fees, and the host's revenue share if it is a percentage of sales.
Fixed costs per year: any fixed rent, power, cleaning and service visits, parts and repairs, connectivity, insurance and permits.
Volume: average servings per day across the year, reduced by the days the machine cannot sell.
Net revenue minus variable cost gives the contribution per serving, which is what each sale leaves over to pay the fixed costs. A figure derived from it is more useful early on than the ROI percentage, because you can check it against reality within weeks of installation:
Break-even servings per day = annual fixed costs ÷ (contribution per serving × 365 × uptime)
Uptime is the share of days the machine is able to sell: not broken, not out of stock, not locked out for cleaning. The same structure works whether you are pricing one ice cream vending machine or planning a route of twenty.
Revenue: price per serving, daily volume and seasonality
Price is the one revenue input you control directly. Start from the nearest alternative a customer could walk to: a kiosk, a café counter, a convenience-store freezer. The machine competes with that option on speed and convenience, so set its price in the same range and adjust it once you have a few weeks of sales.
Then take the tax out, because the operator never keeps it. In the United States, sales tax on food sold through vending machines varies by state and sometimes by city, and some states treat vended food differently from other prepared food. In the UK, HMRC treats all types of ice cream as standard-rated, so at the 20% rate a £5.00 serving brings in £4.17.4 In Germany, ice cream falls within the food categories taxed at the reduced rate5, and federal tax guidance treats sales from vending machines as deliveries of goods rather than restaurant service6, so 7% generally applies and a €5.00 serving nets about €4.67. The same sticker price can leave around 11% less revenue in the UK than in Germany before a single cost is counted. Confirm the treatment for your own setup with a tax adviser.
Daily volume is the least certain number in the model and the one that moves the result most, as the sensitivity table further down shows. The best source is metered sales data from comparable machines: the same type of venue, a similar climate, similar opening hours, broken down by month rather than averaged over a year. Counting passers-by at a candidate site tells you how many people could buy, not how many will. Where nothing comparable exists, a short pilot at one site costs less than a wrong assumption repeated across ten.
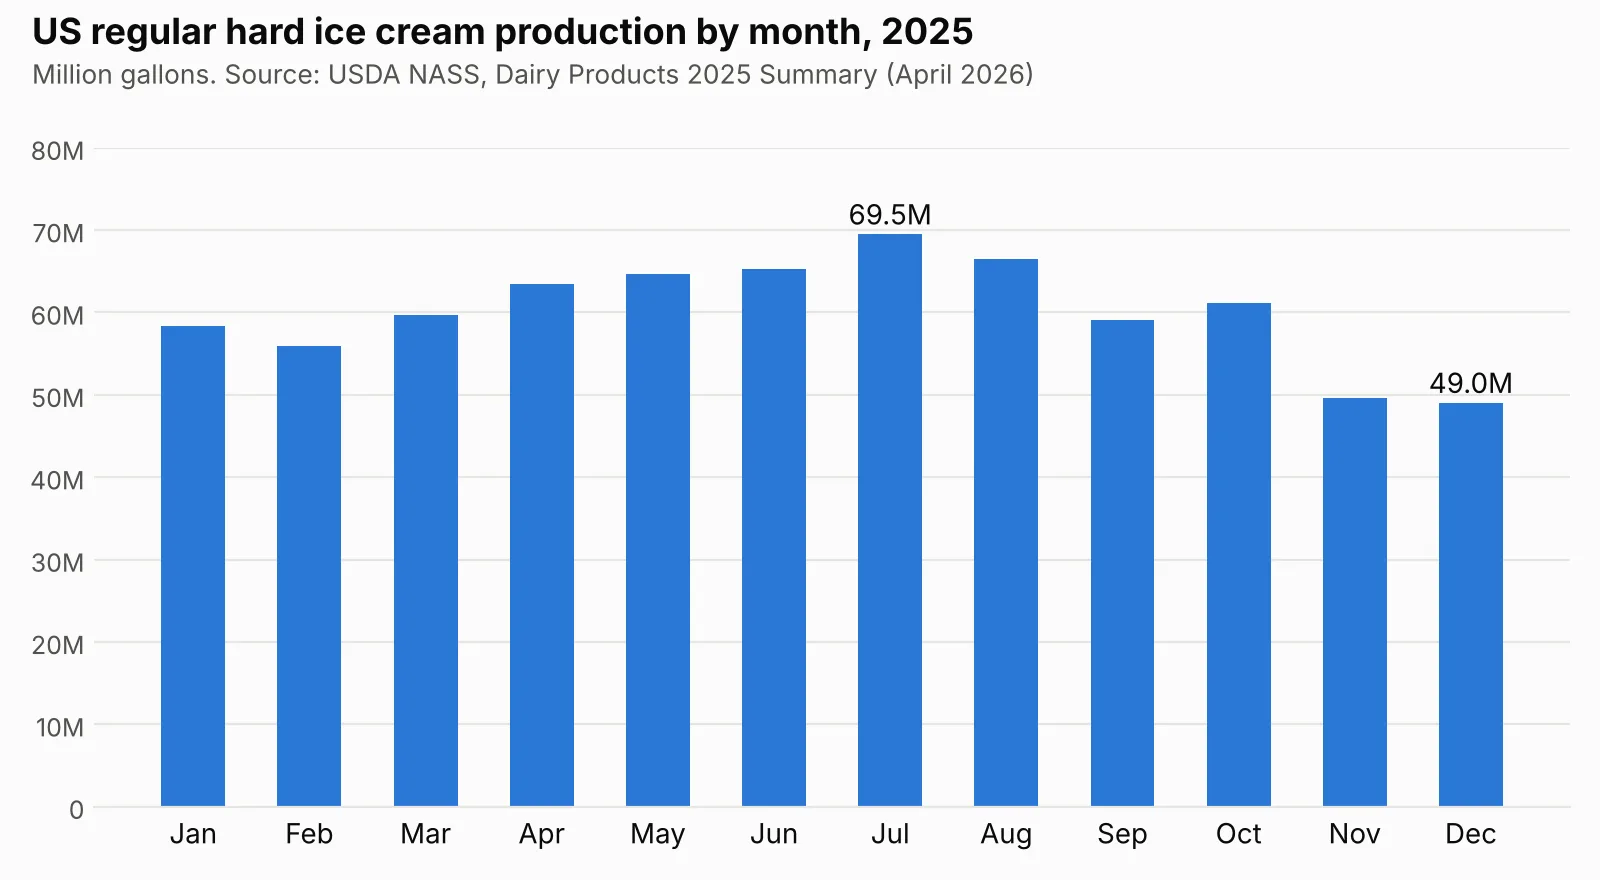
Seasonality needs separate treatment. USDA figures for 2025 show US production of regular hard ice cream peaking in July at 69.5 million gallons and falling to 49.0 million in December, so the busiest month ran about 42% above the quietest.2 The International Dairy Foods Association describes the same pattern, with most US ice cream made between March and August and July the busiest month.3 Factory output is smoothed by cold storage and year-round supermarket buying, so it is better read as a floor for seasonal swing than as a forecast. An outdoor or tourist site can move much further between July and January; an indoor mall or airport may move less.
Figure 1. US regular hard ice cream production by month, 2025. July ran about 42% above December. Source: USDA NASS, Dairy Products 2025 Summary.
The practical method is to estimate servings per day for each of the twelve months at your site, then average them. Use that average in the annual model, and keep the monthly figures for the winter check in the section on planning below.
Cost per serving: mix, cones or cups, toppings and payment fees
Mix is usually the largest ingredient cost, and the way to price it is from yield rather than from the price of a bag: cost per liter of mix divided by servings per liter. Servings per liter depends on the portion size you set and on overrun, the amount of air the freezer whips into the product. Ask the manufacturer for the yield measured on the machine at the portion setting you plan to use. Liquid and powder mixes, and chilled versus shelf-stable ones, also differ in how they are stored and handled, and that difference shows up later as labor and waste.
Waste deserves its own line. Some mix is lost each time the freezer is broken down for cleaning, some expires, and some goes into test servings after maintenance. Ohio's rule for heat-treatment dispensing freezers, for example, requires full disassembly and cleaning at least every 14 days and requires all product left in the machine to be discarded at that point.10 A waste allowance of a few percent of mix cost is a reasonable way to carry this until you have your own records.
Cones, cups, lids, spoons and napkins are plain unit costs; allow for broken cones. Toppings should be costed as an average across all servings: the cost of a topping multiplied by the share of customers who choose one.
Payment fees are easy to underestimate. Where a machine takes card and mobile payments only, fees apply to every serving. Small-ticket processing is often priced as a percentage plus a fixed fee per transaction, and the fixed part weighs far more on a $5 sale than on a $50 one. Ask your payment provider for the all-in rate at your expected average ticket. Monthly telemetry or platform charges belong in fixed costs.
If the host takes a percentage of sales, that is a variable cost as well, and often the largest one after mix. Check whether the share is calculated on gross takings or on sales net of tax. The difference per serving is small, but it adds up over a year.
Fixed costs: location fee or revenue share, power, cleaning and service visits
Host terms usually take one of three shapes: a fixed monthly rent, a revenue share, or a minimum guarantee plus a share. A fixed rent raises the break-even point but leaves the upside with the operator. A pure share lowers the risk at a weak site and costs more at a strong one. Put each set of terms you are offered into the same model, so you can compare them at your expected volume.
Power is rarely what decides the result. Ask for metered consumption in kWh per day at realistic ambient temperatures and sales volumes, not the nameplate rating, and multiply by your actual tariff. For reference, the average US commercial electricity price was 14.04 cents per kWh for January to August 2026 (EIA, preliminary).7 The average UK non-domestic price, including the Climate Change Levy, was 24.51 pence per kWh in the second quarter of 2026 (DESNZ).8 BDEW puts small and mid-sized industrial users in Germany at 17.9 euro cents per kWh so far in 20269, a band that covers connections far larger than a single vending site, so check your own tariff. In the base case below, power comes to under $900 a year.
Cleaning and service visits are usually the largest fixed cost, and two things set how often they happen. The first is the machine's cleaning design together with local food-safety rules. Ohio's rule allows heat-treatment dispensing freezers 14 days between full cleanings (longer only for units certified for an extended interval) but still requires parts such as hopper covers and door spouts to be cleaned and sanitized daily.10 Whether your local authority classes an ice cream vending machine the same way, and which daily tasks follow from that, decides how often someone has to be on site. The second is restocking: how many days the mix and cone capacity lasts at your expected volume. The visit schedule follows whichever comes round sooner.
Cost every visit, including your own. The US Bureau of Labor Statistics reported a median wage of $21.63 an hour for coin, vending and amusement machine servicers and repairers in May 2023.11 Add payroll costs, benefits, the vehicle and drive time, and the loaded cost per hour sits well above the wage; the scenarios below assume $35 an hour and 1.25 hours per visit, travel included. If you plan to service the machine yourself, put your own time in at the same rate. Leaving it out overstates what the machine earns.
The remaining fixed lines are smaller but real: a reserve for parts and repairs, connectivity and telemetry fees, insurance, permit or license fees where your local authority charges them, and cleaning supplies.
Three scenarios with every assumption shown
The table sets out three hypothetical cases for one machine in the United States. None of them is a forecast. All three assume a cleaning design and local approval that allow visits a few times a week; the optimistic case visits more often than the others only because it sells more and needs restocking sooner. The effect of a daily visit requirement is shown separately below.
Hypothetical assumption | Conservative | Base | Optimistic |
|---|---|---|---|
Revenue | |||
Shelf price, tax included | $4.50 | $5.00 | $5.50 |
Sales tax (assumed) | 7% | 7% | 7% |
Net price per serving | $4.21 | $4.67 | $5.14 |
Average servings per day, full year | 20 | 40 | 80 |
Uptime | 90% | 95% | 98% |
Variable costs per serving | |||
Mix | $0.55 | $0.45 | $0.40 |
Waste allowance, % of mix cost | 10% | 6% | 4% |
Cone or cup, napkin | $0.15 | $0.12 | $0.10 |
Toppings, averaged over all servings | $0.10 | $0.10 | $0.10 |
Card fees | 6% + $0.10 | 5% + $0.07 | 4% + $0.05 |
Host revenue share, % of net sales | 20% | 15% | 10% |
Contribution per serving | $2.14 | $2.95 | $3.74 |
Fixed costs per year | |||
Power, kWh per day at $0.15/kWh | 14 kWh → $767 | 16 kWh → $876 | 18 kWh → $985 |
Service visits a week, 1.25 h at $35/h | 3 → $6,825 | 3 → $6,825 | 4 → $9,100 |
Parts and repairs reserve | $1,500 | $1,000 | $1,200 |
Telemetry, insurance, permits, supplies | $1,300 | $1,300 | $1,300 |
Total fixed costs (rounded) | $10,400 | $10,000 | $12,600 |
Results | |||
Servings sold per year | 6,570 | 13,870 | 28,616 |
Operating profit before capital (rounded) | $3,700 | $31,000 | $94,400 |
Break-even servings per day | 15 | 10 | 9 |
All figures are hypothetical assumptions for illustration, calculated before capital cost, income tax and financing. Results are rounded.
Three things stand out. First, the conservative case is positive but thin: at 20 servings a day it clears its fixed costs by about $3,700 a year before capital, and it breaks even at about 15 servings a day. Of the fixed costs, visit frequency moves that line the most. If local rules or the machine's cleaning design called for a visit every day, the same site would need about 28 servings a day to break even, which is why the cleaning interval belongs on your list of questions for the manufacturer. Second, the base and optimistic cases break even at almost the same volume, around 9 to 10 servings a day, because the optimistic case carries more service cost; what separates them is everything sold above that line. Third, the spread between the cases is wide. Running three cases shows which assumptions the result rests on.
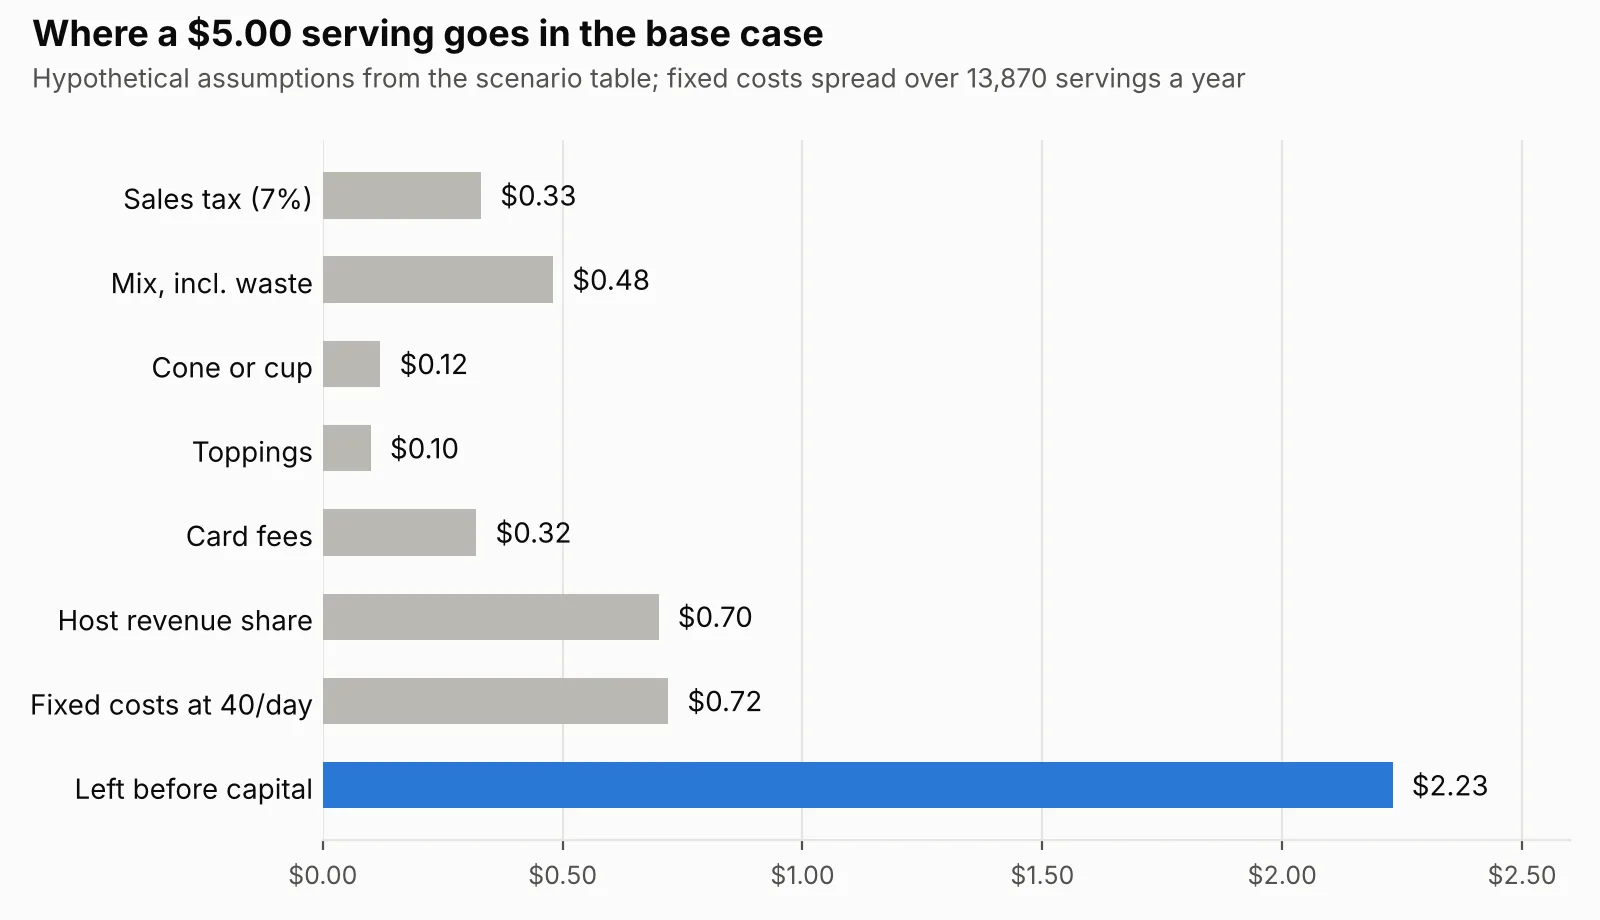
Figure 2. Where a $5.00 serving goes in the hypothetical base case. After tax, ingredients, card fees, the host's share and fixed costs spread over the year's sales, about $2.23 is left before capital.
To see which inputs matter most, change one at a time from the base case and leave everything else alone:
One change from the base case | Annual operating profit | Change |
|---|---|---|
Base case, unchanged | $31,000 | — |
Daily service visits instead of three a week | $21,900 | −29% |
Servings per day 20% lower (32 instead of 40) | $22,800 | −26% |
20% VAT in place of 7% sales tax | $25,000 | −19% |
Price $0.50 lower | $25,800 | −17% |
Host revenue share 5 points higher | $27,700 | −10% |
Uptime 5 points lower | $28,800 | −7% |
Mix $0.10 more per serving | $29,500 | −5% |
Power use 50% higher | $30,500 | −1% |
Hypothetical base case; each row changes one assumption and holds the rest. Profit figures rounded to the nearest $100.
Volume and visit frequency dominate. Price and the host's share come next. Power barely registers. For a UK operator, the tax row matters too: at the same nominal price, the 20% VAT rate takes about a fifth of the base-case operating profit compared with a 7% rate.
The last step is the capital. Divide your total installed cost by the number of years you expect the machine to earn, which is its economic life and may differ from the schedule your accountant uses for tax, to get annual depreciation. In the base case, every $1,000 of annual depreciation adds roughly one serving a day to the break-even point. Then apply the ROI formula from the start of this guide to your own quoted installed cost. Run the conservative case through the formula as well as the base case, so you can see the range before you commit.
Planning for dwell time, uptime and the winter months
Dwell time. Buying from a machine takes a pause: read the menu, pay, wait for the serving, collect it. People waiting for a film to start, sitting near a play area or lingering around a food court have that time, and a site with less traffic but longer waits can outsell a busy corridor where people are hurrying through. If you are assessing an ice cream vending machine for malls, look at where people sit and wait as well as at entrance counts.
Uptime. In the base case, five points of lost uptime cost about $2,200 a year, and the loss is uneven: a day lost in July costs more than a day lost in February because each July day carries more servings. Running out of cones or mix counts as downtime, and so does a machine locked out because a cleaning interval was missed. Plan restocking and cleaning around the busy months, and where the machine has remote stock and fault alerts, use them to schedule visits before it stops selling.
Winter months. Fixed costs keep running when sales fall. Build the model month by month as well as for the year, so you can see how many months run below break-even and plan cash for them. Where the host agreement allows it, a lower winter rent, fewer visits where the rules permit, or moving the machine indoors for the season can change the picture. Each of those options has a cost of its own, and it belongs in the model too.
What to ask your supplier for before you build the model
Most inputs in this model are yours to research: price, host terms, local rules and site traffic. A few can only come from the manufacturer, and they are worth asking for in writing before you compare offers:
Measured yield: servings per liter of mix at the portion size you plan to sell.
Power use: metered kWh per day at realistic ambient temperatures and sales volumes.
Cleaning design: the interval between full cleanings, the daily tasks, and the approvals behind them in your market.
Capacity: how many servings the mix, cones or cups and toppings hold before a restock.
Installed cost: what the quotation includes, and what freight, duty, installation and electrical work will add.
Payments: which card and mobile payment options the machine supports in your market.
Before you rely on the result, check your own model on the points that most often move it: volume estimated by month, prices net of tax, card fees, waste and the host's share included in the cost per serving, every visit costed, stock-outs and cleaning lockouts counted in uptime, and a look at the three weakest months and at 70% of the assumed volume.
iMaster can work through these inputs with you for the sites you have in mind. When you send an inquiry, include your target market, the type of site, how many machines you plan to place and the daily volume you expect. If you are planning a first placement or adding machines to a route, see our vending machine solutions for operators.
References
[1] NAMA Foundation, "The 2024–25 State of Convenience Services" (developed with Technomic), as reported by Vending Market Watch, "NAMA's convenience services census pegs 2025 revenue at $31.1 billion" (March 20, 2026). https://www.vendingmarketwatch.com/management/news/55365563/national-automatic-merchandising-association-nama-convenience-services-revenue-hits-311-billion-in-2025-nama-says
[2] USDA National Agricultural Statistics Service, Dairy Products 2025 Summary (April 2026). https://esmis.nal.usda.gov/sites/default/release-files/795874/daryan26.pdf
[3] International Dairy Foods Association, "Ice Cream Sales and Production Remain Hot Ahead of National Ice Cream Day" (July 15, 2021). https://www.idfa.org/news/ice-cream-sales-and-production-remain-hot-ahead-of-national-ice-cream-day
[4] HM Revenue & Customs, VAT Food Manual, VFOOD5520: Excepted items: ice cream and similar products. https://www.gov.uk/hmrc-internal-manuals/vat-food/vfood5520
[5] German VAT Act (UStG), Annex 2, item 33 (Chapter 21 food preparations). https://www.gesetze-im-internet.de/ustg_1980/anlage_2.html
[6] German Federal Ministry of Finance (BMF), letter of March 20, 2013 on distinguishing supplies of goods from services in the sale of food and drink, including sales from vending machines.
[7] U.S. Energy Information Administration, Electric Power Monthly, Table 5.3: Average Price of Electricity to Ultimate Customers (data through August 2026). https://www.eia.gov/electricity/monthly/epm_table_grapher.php?t=epmt_5_3
[8] UK Department for Energy Security and Net Zero, Quarterly Energy Prices, September 2026. https://assets.publishing.service.gov.uk/media/6aba2810fe72ed1e2b02f0e7/Quarterly_Energy_Prices_September_2026.pdf
[9] BDEW, Strompreisanalyse, October 2026. https://www.bdew.de/media/documents/BDEW_Strompreisanalyse_102026_1.pdf
[10] Ohio Administrative Code 3717-1-08.1, Special requirements: heat treatment dispensing freezers (effective September 5, 2024). https://codes.ohio.gov/ohio-administrative-code/rule-3717-1-08.1
[11] U.S. Bureau of Labor Statistics, Occupational Employment and Wages, May 2023: 49-9091 Coin, Vending, and Amusement Machine Servicers and Repairers. https://www.bls.gov/oes/2023/may/oes499091.htm